The use of combined EEG-fMRI recording in epilepsy research is a growing and promising field, with great potential to expand our understanding of epilepsy. The patient has electrodes fixed to their head outside of the scanner using a conductive paste. When the patient enters the scanner, the electrodes are connected to an amplifier in the scanner room, which is in turn connected to a computer outside the scanner room via a fiber optic cable. The strong magnetic field in the scanner environment has a detrimental effect on the quality of the EEG. During fMRI scan acquisition, the Radio-frequency (RF) pulse used to generate the fMRI signal creates an artifact that completely obscures the EEG. It is then necessary to filter the EEG after the scanning session to remove this artifact.

An experienced epileptologist reviews the EEG, indicating the timing of the spikes. Generally, we are interested in interictal events (spikes that are not part of a seizure) rather than ictal events. It is difficult to capture a seizure during the limited (2 hour) scan time, and any movement that occurs during the seizure may blur the image to such a degree that it becomes useless. Knowing the timing of the spikes (the events) and the timing of the MRI scans allows us to examine the fMRI signal at that time to look for responses related to the event.
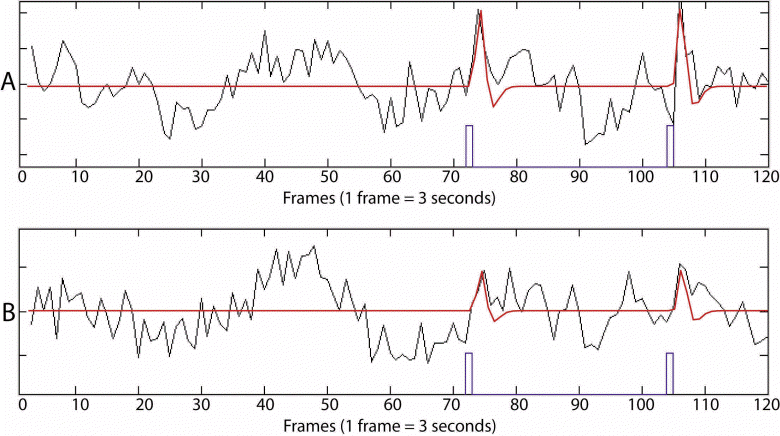
Once the timing of the events has been determined, we analyze the fMRI signal. We record a number of runs (usually 10 to 14). Each run has 120 scans of 25 slices (5mm x 5mm x 5mm voxels) that usually covers the entire brain, and takes 6 minutes to complete. Our typical scanning time, including setup and anatomical scans, is 2 hours. Prior to analysis, we correct for any movements the patient may have made. With the event timing, we examine the fMRI activity at that time to look for activation. We use fmristat, an analysis method developed at McGill by Keith Worsley (Worsley et al. 1996, 2002). The fMRI signal is referred to as the BOLD (blood oxygen level dependant) signal. The fMRI signal is not a direct result of neuronal firing, but a metabolic response based on increases in the deoxygenation of hemoglobin caused by neuronal activity. A neuronal event has an expected change in the BOLD signal (the hemodynamic response). To analyze the data, we create a model in which a pre-determined hemodynamic response function (HRF) is locked to the event timing. Thus, at every time in which there is an event there is a corresponding HRF. We then compare this model to the actual BOLD signal. If there is a good correspondence between the model and the signal, we have a response. Responses can be an increase (activation) or a decrease (deactivation). We use 4 separate HRFs, and then combine them to create a combined map

Examples of BOLD signal in a single voxel (5x5x5mm of brain tissue) during a 6 minute scan of 120 measurements (frames). The blue marks show the approximate timing of an interictal EEG event, and the red line shows an approximation of the model used to analyze the data. In part A the BOLD change to the EEG event is very clear and distinct. In part B, the change is smaller, but still noticeable by the naked eye. The voxel represented by part A has a stronger activation than part B. The signal is not always as clear as in this example.
We have performed studies of focal epileptic spikes caused by different types of lesions, as well as studies of the BOLD response to generalized epileptic discharges. Results show most often activations in the expected epileptic focus, but also often activations and deactivations at a distance. We are investigating the meaning of these distant responses. This remains at present a research tool and its clinical applicability is still uncertain.

A statistical map of activation in a patient with left temporal spikes. Note the main area of activation on the left side, and the small activation in the contralateral area on the right.