One of our current research objectiveis to compare and combine two promising non-invasive imaging modalities to better identify brain areas where interictal spikes are generated:
- EEG source localization techniques, allowing to estimate a current density of brain activity along the cortical surface at each time sample of the spike
- Simultaneous EEG/functional Magnetic Resonance Imaging (fMRI) acquisitions, as a technique by which the hemodynamic correlates of EEG activity can be found.
Comparing results from those imaging modalities is a key issue for the following reasons:
- Different physiological origins of the measured signals: neuronal current vs hemodynamic response
- Complementarity of spatial and temporal resolutions: 1ms and 1cm for EEG source localization, 1s and 5mm for simultaneous EEG/fMRI)
- Drawbacks of each processing method: non uniqueness of the EEG source localization problem unless we add some prior information and detection sensitivity ranging from 50 to 60% in EEG/fMRI analysis.
In order to provide a complete multimodal analysis, all those results may then be superimposed on a high resolution anatomical MRI, allowing accurate identification of the anatomical structures involved during spike generation. Results can either be considered as concordant, which will bring more confidence in accepting them, or complementary, which may then highlight a network of anatomical structures involved in spike generation. However, such a comparison is a difficult task. Indeed, EEG source localisation methods provide a spatio-temporal map of current density on the cortical surface, whereas EEG/fMRI analysis provides a statistical map of activation. Our objective is to develop a methodology dedicated to such a comparison or fusion in the clinical context of epilepsy, since none is available at present. Particular attention must be paid to the following issues:
- Appropriate EEG/fMRI comparison requires that both data are estimated on the same spatial support, i.e., the cortical surface: see Makni S., Grova C. et al. Proceedings of HBM Conference, Toronto, 2005
- The ill-posed nature of the EEG inverse problem should be taken into account in such comparison: see Daunizeau J., Grova C. et al IEEE Signal Processing, Oct 2005, where we proposed a method to test if some specific part of fMRI information may be pertinent or not to constrain the EEG inverse problem.
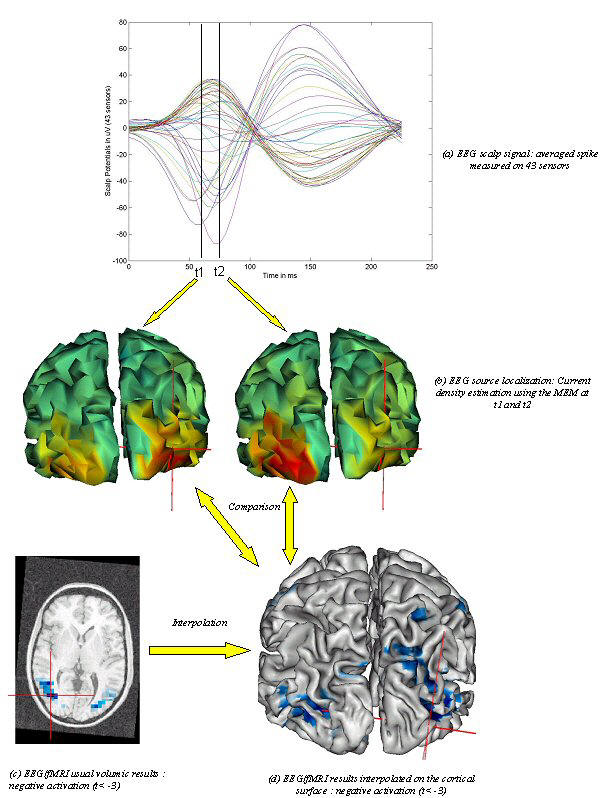
Multimodal analysis of interictal spikes: visual comparison of EEG source localization and fMRI response. (a) An average spike computed from an EEG acquired on 43 channels outside the scanner, two waves in the first peak of the spike (t1 and t2) were visually selected here. (b) EEG source localization using the MEM approach, i.e., current density estimated at t1 and t2 on the cortical surface segmented from the patient’s anatomical MRI. (c) fMRI negative activation obtained from the analysis of interictal spikes similar to (a) (thresholded t-map, t<-3) superimposed on the patient’s anatomical MRI. (d) Interpolation of fMRI results on the cortical surface for comparison purposes. Both scalp potentials and EEG source localization (b) showed a propagation of the spike between t1 and t2 from the right occipital to the left occipital lobe. Those results were concordant with the bilateral negative activation found in the occipital lobes using fMRI data (c). Whereas visual comparison between (b) and (c) gives a general idea of a good concordance between EEG and fMRI, interpolating fMRI data on the cortical surface (d) is a necessary step to provide quantitative measurement of such concordance or to use fMRI as a constraint in the EEG source localization problem to test the reliability of this concordance.
We will also use data from intra-cranial EEG recordings performed in some epileptic patients (~15 patients/year) to help validate our results. These innovative approaches will provide a more accurate localization of spike generators and a better understanding of the mechanisms involved during spike generation and propagation.

Results of SEEG, which represents the 'gold standard' of EEG localization. The red points were involved in interictal events. The bilateral activation helps validate the results of our multimodal analysis.