Tamir will present his work at the Organization for Human Brain Mapping conference, Online (June 2020)

Petr presented his work at the American Epilepsy Society annual meeting, Baltimore (December 2019)

Veronique presented her work at the World Sleep Congress in Vancouver (September 2019)

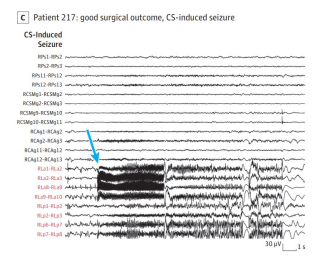
Inducing seizures to stop seizures
Induction of seizures was associated with better surgical outcome; a higher percentage of resected contacts from the seizure-onset zone informed by cortical stimulation, similar to that of spontaneous seizures, was associated with better surgical outcome.

Atlas on normal brain activity
This atlas is unique and a first attempt to fill an important gap. Whereas the normal scalp EEG is fully documented which serves as a baseline for interpretation of the pathological EEG, the normal intracerebral EEG has not yet been defined. This, however is important, as only by having defined normative values, conclusions on deviations from the norm can be drawn. This latter is true for the EEG background activity, but also new markers of the epileptogenic zone, the so-called high-frequency oscillations which rates are highly variable depending on the different brain regions.
This project is an international multicenter project for the development of a 3-dimensional atlas of physiological brain activity during wakefulness and sleep. It currently includes three epilepsy surgery centers in Canada and in Europe (McGill: Drs. Frauscher, von Ellenrieder, Dubeau, Gotman; University of Montreal: Dr. Nguyen; University of Grenoble-Alpes: Dr. Kahane, Hofmann, Minotti) and will soon incorporate additional research institutions. The data are provided on an open access basis for teaching and research (https://mni-open-ieegatlas.research.mcgill.ca/). The project was endorsed by the International League against Epilepsy in 2016.

Figure 1 shows the position of 1785 channels with normal brain activity which were identified from 106 patients. In blue are channels recorded with SEEG, in yellow are channels recorded with grids/strips. There were on average 2.7 channels per cm3 of cortical grey matter (from Frauscher et al. Brain 2018).

Figure 2 gives a rough global idea of the distribution of rhythms in the brain, and shows a posterior to anterior gradient of increasing frequencies (from Frauscher et al. Brain 2018).

Figure 3 provides the distribution of physiological ripple rates (80-250 Hz), represented on the inflated cortex. Top: 95th percentile of the physiological ripple rate per brain region. Bottom: rate of the individual channels, each dot represents a channel, the size and color indicates its ripple rate (from Frauscher et al. Ann Neurol 2018 in press).
![]() Frauscher et al., Ann Neurol 2018
Frauscher et al., Ann Neurol 2018
Developing and validating novel non-invasive neuroimaging markers for prediction of the epileptogenic zone
Intracranial EEG (iEEG) is the current gold standard for defining the epileptogenic zone. Despite its clinical relevance and utility, it has the obvious limitation of being invasive. It is also expensive, and its sampling of the total cortical volume is limited. Moreover, it is not available at all epilepsy centers performing epilepsy surgery because of the complexity of electrode implantation. To address this gap, we are developing novel non-invasive neuroimaging markers for prediction of the epileptogenic zone. We prospectively explore if these markers can in fact allow to predict the results as obtained by iEEG. Ultimately, these markers will improve the placement of invasive EEG electrodes and might even make implantation unnecessary in a subgroup of patients. This is a new research direction of our lab focusing on HD-EEG and multimodal MRI as two powerful neuroimaging methods suitable for non-invasive delineation of the epileptogenic zone. This project is a collaboration with the labs of Boris Bernhardt at the MNI and Christophe Grova at Concordia University.
Interactions between epilepsy & sleep as explored by intracranial EEG
In contrast to recording conditions on the scalp, intracerebral electrodes are in direct contact with the epileptic generators that not only include the crowns of gyri, but also sulci, white matter, and structures seated deeply in the brain. We use SEEG in order to study the relationship between interictal EEG markers and sleep microstructure, such as slow oscillations or rapid eye movements in order to further explore underlying mechanisms. Our results contributed to highlight the role of EEG synchronization / desynchronization, and showed that interictal EEG markers are coupled to sleep slow oscillations, and that phasic as opposed to tonic REM sleep is associated with a significant suppression of interictal activity. Our work will ultimately contribute on how the coupling with different sleep phenomena such as sleep slow oscillations and rapid eye movements will be useful to better delineate the epileptogenic zone.

Figure 1 shows the variation in time of the high-frequency oscillation density. Time zero corresponds to the peak of the negative half waves, and their beginning and end are indicated by the gray bands. An increase in HFO density is observed at the transition between the negative half-wave and the preceding positive one in channels with epileptic EEG activity (red dotted line), but not in channels with normal EEG activity (blue solid line). In contrast, there is an increase in HFO density at the transition between the negative half-wave and the following positive one in channels with normal EEG activity (from Frauscher et al., Brain 2015).

Figure 2. Distribution of interictal epileptic events (spikes, ripples, fast ripples, and burst duration) across phasic (blue) and tonic (light blue) REM sleep (from Frauscher et al. Epilepsia 2016).

Figure 3. Example showing the HFO rate and the time varying rate predicted by two Poisson process models common for every subject. The prediction in black corresponds to a model taking into account sleep stage and accumulated time in each stage. The prediction of the best model is shown in blue, and includes also the variables measuring the slow wave amplitude, the sigma band activity, and in the case of pathological ripples and fast ripples also the delta band activity. The rate is plotted as a function of time, and the sleep stage is indicated in color at the bottom of the graphs. Observe the rate increase with time during REM sleep for physiological ripples by comparing the vertical position of the red arrows, and a decrease during NREM sleep for pathologic ripples and fast ripples (most marked during stage N3, indicated also by the difference in the vertical position of the arrows) (from von Ellenrieder et al. Neuroimage Clinical 2017).
![]() Frauscher et al., Epilepsia 2016
Frauscher et al., Epilepsia 2016
![]() von Ellenrieder et al., Neuroimage Clinical 2017
von Ellenrieder et al., Neuroimage Clinical 2017
Use of invasive intracranial EEG to study sleep physiology
SEEG in presurgical epilepsy evaluation offers the unique possibility to study directly brain physiology, as patients with focal drug-resistant epilepsy are the only patients who are undergoing chronic implantation with invasive intracranial EEG electrodes. Our lab is interested to study sleep physiology using this approach. The figures below will illustrate some examples of our work.
Scalp sleep spindles have widespread intracerebral correlates

Figure 1. Illustration of the sampled brain regions and the percentages of intracranial sigma band activity at time of scalp spindles. The circles correspond to the investigated brain regions. The area of the circles is proportional to the number of investigated channel in each brain structure, and the color indicates the percentage of channels in which a statistically significant increase in sigma band energy (10 – 16 Hz) was observed during the scalp spindle intervals compared to the control intervals (from Frauscher et al., Neuroimage 2015).

Figure 2: Histogram of local minima around scalp spindles. Each row corresponds to a different channel and each column to a different 2 ms bin. Time zero corresponds to the marked onset of the spindles. The color indicates the number of local minima in each bin, accumulated for all the spindle intervals (50 spindle intervals in most cases). The top 37 rows correspond to the marked spindles, the middle rows to other scalp channels, and the bottom half to the investigated intracranial channels, sorted by p-value in the paired t-test comparing the sigma band energy in the spindle and control intervals. Synchrony is consistently observed in the scalp channels but not in the intracranial channels indicating that for every spindle the delay between scalp and intracranial channels is different (from Frauscher et al. Neuroimage 2015).
Theta waves are the correlate of ponto-geniculo-occipital waves in the human primary visual cortex.

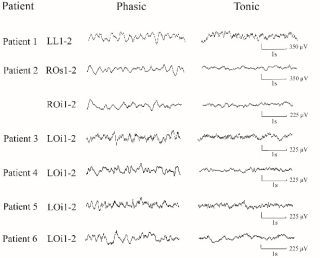
Figure 3. Typical EEG activity contrasting phasic versus tonic REM sleep in the primary visual cortex. During phasic REM sleep, we observe theta transients with durations between 150-250 msec not seen during tonic REM sleep. No classical PGO waves were however identified (from Frauscher et al. Clin Neurophysiol 2018).