Your feedback makes a difference!
Your feedback makes a difference!
One purpose of the course evaluation system is to inform students about courses and instructors. Under certain conditions, previous numerical course evaluation results are available to consult. This page contains information to help you understand and interpret these results.
Numerical results of course evaluations are available when the following two conditions are met:
| Class Size | Response Rate (%) |
|---|---|
| 5 - 11 | minimum 5 responses |
| 12 - 30 | at least 40% |
| 31 - 100 | at least 35% |
| 101 - 200 | at least 30% |
| 201 or more | at least 25% |
Note: For courses with multiple instructors, all instructors assigned to the course must not object to access for course evaluation results to be disseminated to students.
In all cases, written comments are confidential to the instructor and the academic unit head or their delegate.
Results are available according to the following schedule:
Fall evaluations: March the following calendar year
Winter evaluations: June the same calendar year
Summer evaluations: October the same calendar year
As at December 2019:
2,376 instructors have granted permission for their numerical results to be available (view report).
1,255 of the 2,602 (48%) courses evaluated met the response thresholds required for results to be available.
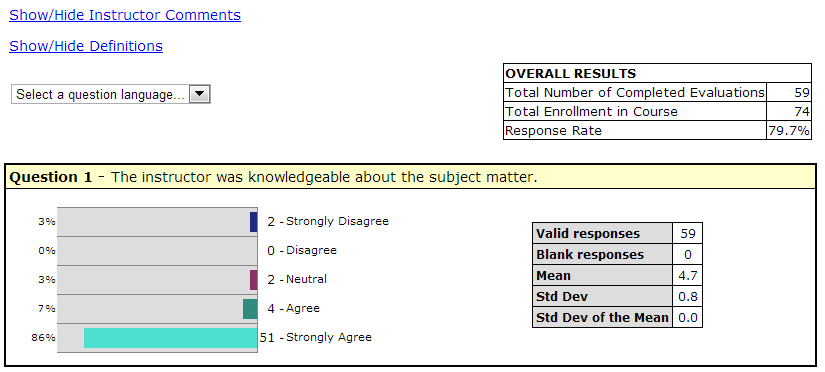
The number of students who submitted the evaluation.
The number of students enrolled in the course.
The sum of the “Total Number of Completed Evaluations” and the "Total Number of Declined Evaluations," divided by the “Total Enrollment in the Course or Course Section," expressed as a percentage.
The number of students who selected one of the options provided for the question.
The number of students who did not select an option for the question. Blank responses are NOT included in any calculations. Note: The number of “Valid responses” plus the number of “blank responses” should equal the “Total Number of Completed Evaluations”.
The sum of all “valid responses” divided by the number of “valid responses”. Note: The closer the mean is to 5, the closer it is to “strongly agree/ excellent”.
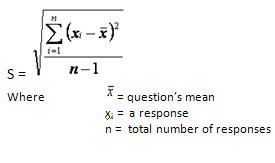
The standard deviation is a measure of the variation of the distribution of a data set. The standard deviation provides information about the distribution of responses, and underlines the danger of looking at the mean alone without considering the variance.
Formula: The standard deviation is calculated as the square root of the arithmetic mean of the squares of the deviation from the arithmetic mean. As this is a calculation on a sample rather than the population, the result is an estimated standard deviation and is expressed in the same units as the data.
Why look at the Standard Deviation?
For example, the following three cases illustrate how the same mean, 3, summarizes three data sets with completely different features. Clearly, the estimated standard deviation is needed in conjunction with the sample mean to better describe a data set.
| Case 1 | Case 2 | Case 3 |
Student responses: 5 x “1” and 5 x “5”
|
Student responses: 2 x “1”, 2 x “2”, 2 x “3”, 2 x “4” and 2 x “5”
|
Student responses: 10 x "3"
|
This is an estimate of how representative the sample mean (those responding to the questionnaire) is of the population mean (the whole class).
Formula: The variability of the sample mean is, naturally, smaller than the variability in the individual observations. This is usually taken to be the estimated standard deviation of the observations, divided by the square root of the sample size. When sampling from a “small” finite population this variability will be reduced. A finite population estimator of the standard deviation of the sample mean is given by:
If you review results from previous courses, it is important to interpret the numbers in a meaningful way. Some points to remember are:
The mean is not sufficient to provide a picture of the distribution of responses. When interpreting the numerical results, consider information such as the distribution of responses by item as well as the variation in responses. Generally, differences that are less than .5 above or below the mean should be regarded as functionally equivalent.
The standard deviation provides important additional information about the variability of student responses. A standard deviation for a question greater than 1 indicates relatively high differences of opinion.
Ratings of global items are the most useful as indicators of overall instructional effectiveness (e.g., “Overall this instructor is an excellent teacher”; “I learned a great deal from this course”). Responses to these questions are found to correlate most consistently with measures of actual student achievement. Generally, mean scores over 4 are considered strong and mean scores of 3.5 to 4 represent solid results.
While this web page is accessible worldwide, McGill University is on land which has served and continues to serve as a site of meeting and exchange amongst Indigenous peoples, including the Haudenosaunee and Anishinabeg nations. Teaching and Learning Services acknowledges and thanks the diverse Indigenous peoples whose footsteps mark this territory on which peoples of the world now gather. This land acknowledgement is shared as a starting point to provide context for further learning and action.